Report on a Preliminary Investigation of
Ground-Level Ambient Methane Levels in
Manhattan, New York City, New York
[This is an initial report subject to revision.]
16 December 2012
Robert Ackley and Bryce F. Payne Jr. , PhD
Gas Safety, Inc.
Southboro, Massachusetts
BACKGROUND
There are serious environmental concerns with the development of shale gas and the related new gas industry infrastructure, and recent investigations have raised concerns about the role of cities in assuring the public and environmental safety of natural gas use. In cities gas will be distributed and delivered through existing and new gas lines, almost all buried under city streets and sidewalks. In most U.S. cities the gas lines have been in place for decades. Consolidated Edison, Inc. (ConEd) in New York City, for example, has been installing gas lines underground since the early 1800s and now has a system of 4320 miles of gas pipe.[1] ConEd has installed pipes under almost every street or sidewalk in their service territory (except northern Westchester). The ConEd gas system in the 23-square mile service area in Manhattan delivers gas through 336,000 customer gas meters. All underground pipes, as in the ConEd gas system, are subject to stresses and strains of corrosion, and physical damage during excavation or due to natural forces. It follows that such extensive, complex and largely aged pipe systems will have maintenance requirements and will develop leaks and other problems that have to be managed to prevent explosion hazards and property damage, e.g. to urban trees, and to assure public and worker safety.
In addition to the more obvious concerns about safety, (such as explosions and wasted gas) there is an additional concern that arises from the fact that commercial natural gas is almost entirely comprised of methane. This naturally occurring gas is formed deep in the earth during the geological processes that form oil and coal, and near or at the earth’s surface by biological processes, like decay of sewage, or in the gut of mammals. Until recently, CO2 has received most of the attention as a problematic greenhouse gas; yet now there is an increasing awareness of the role of methane, which has an unusual potency as a greenhouse gas. Depending on how it is calculated, methane is 20 to 100 times more potent as a greenhouse gas than carbon dioxide.[2] However, because
[1] http://www.coned.com/PublicIssues/PDF/GLRP1210c.pdf
[2] Differences in the greenhouse potency of methane compared to carbon dioxide arise from differences in how long these two gases typically remain in the atmosphere. Once released into the air both methane and carbon dioxide are removed relatively slowly, but carbon dioxide disappears about ten times more slowly than methane. Consequently, if compared on a ten-year time frame the faster removed methane has a relatively higher effect (methane 100 times CO2) than when compared over a one-hundred-year time frame during which the longer-lived carbon dioxide will have a stronger overall effect (methane 20 times CO2). See Intergovernmental Panel on Climate Change (2007) IPCC fourth assessment report (AR4). Working Group 1, The Physical Science Basis. http://www.ipcc.ch/publications_and_data/ar4/wg1/en/contents.html, and Shindell DT, Faluvegi G, Koch DM, Schmidt GA, Unger N, Bauer SE (2009) Improved attribution
of climate forcing to emissions. Science 326:716–718
burning natural gas generates less carbon dioxide than burning coal or oil, natural gas has been considered a cleaner energy source. However, because methane is such a potent greenhouse gas, if only a small amount leaks into the atmosphere during extraction, transport and delivery of natural gas to the consumer, the smaller carbon footprint of natural gas burned as fuel grows quickly. Recent estimates are that if more than 2% of natural gas produced at a well is lost to the atmosphere before it is burned by the consumer, then natural gas will no longer be a cleaner fuel than coal with respect to global warming.[1] How much urban gas distribution and delivery systems may be contributing to exceeding that 2% loss rate is only beginning to be understood.
To begin to better understand the role of NYC with regard to these and other concerns about natural gas safety and global climate concerns a group of private donors in NYC funded Damascus Citizens for Sustainability (DCS) to commission a preliminary investigation of natural gas leaks in parts of the Manhattan Borough. DCS engaged Gas Safety, Inc. (GSI) of Southboro, Massachusetts to perform the preliminary investigation.
METHOD
The investigation involved a road survey of ground level ambient air methane levels using a methane (natural gas) leak surveyor system comprised of a cavity ring-down spectrometer combined with a GPS system and computer control system. The leak surveyor was installed in an automobile with an air sampling line mounted over the rear bumper to ride with the inlet facing down approximately 1 foot above the pavement surface, and the GPS antenna on the roof. The instrument measures and records methane levels in the air above the pavement with an accuracy of a few parts per billion (ppb) about 4 times per second. The onboard GPS system simultaneously records the location of the instrument as sampling occurs.
To confirm the reliability of the methane surveyor several leaks were confirmed by locating the actual points in the road surface from which methane was actually being released into the air. Methane levels just below the surface at the actual methane release points were too high to be measured using the spectrometer and were instead measured using a conventional combustible gas indicator.
[1] Robert W. Howarth , Renee Santoro and Anthony Ingraffea, 2011. Methane and the greenhouse-gas footprint of natural gas from shale formations — A letter. Climatic Change. DOI 10.1007/s10584-011-0061-5
RESULTS
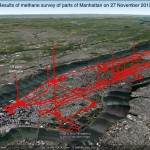
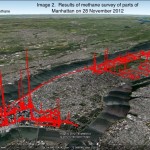
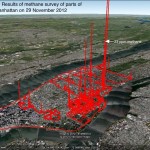
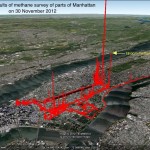
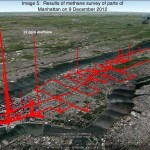
The surveyor was driven over 160 miles of selected roads in Manhattan from 27-30 November and 9 December 2012 (see Images 1-5). Methane measurement functions were normal during the survey. However, in some areas in Manhattan tall buildings block GPS satellite signals. Consequently GPS data was intermittent, with deviations from actual driven paths apparent in the visualization of the data in the Google Earth images in this report. Loss of GPS signal caused the plotted survey course in the images to appear to occasionally randomly curve off roadways (see Images 1-5). Those random deviations are minor location errors in the plotted survey course, had no functional connection or impact on the methane data, and did not impact the reliability of the methane leak survey. The survey generated over 700,000 methane measurements, and associated numbers of time and location data points. Those data are presented visually in Images 1 through 6 in this report.
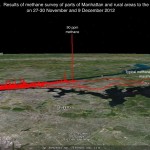
During the survey the periphery of the island was driven at different times. Also, the surveyor was intentionally left on during GSI travel from and to Southboro, MA. The data collected on the cross-country drives from and to Massachusetts provided reference methane levels for comparison to those measured in Manhattan (see Image 6 and DISCUSSION below). Methane levels measured along the upwind periphery of Manhattan were similar to those measured on the cross-country drives.
Images 1-5. Results for each day of the methane survey of ground level ambient air in Manhattan on 27-30 November and 9 December 2012. The height of the red line (curtain) indicates ambient air methane levels (in ppm) 1 foot above the road surface along the survey course. One or more peaks are labeled with the associated methane level (in ppm) to provide scale. The viewer should be aware of the perspective in the images, i.e., similarly sized peaks will appear smaller at visually more distant areas of Manhattan in the images.
Image 6. Preliminary gas leak survey of Manhattan 27-30 November 2012 and 9 December. This image provides a visual impression of the relative levels of methane in ambient air in Manhattan compared to levels on open country highways travelled to and from Manhattan. The height of the red line (curtain) indicates ambient air methane levels 1 foot above the road surface along the survey course. One or more peaks are labeled with the associated methane level (in ppm) to provide scale.
DISCUSSION
The survey indicated that natural gas leaks are occurring generally throughout the Manhattan Borough (see Images 1-5). This preliminary study was more intense in some southeastern and southern parts of Manhattan. Leaks appeared more common in those areas. A more thorough study would be necessary to definitively discriminate areas that may have more or larger leaks than other areas. The preliminary investigation
results indicated hundreds to thousands of likely leaks in the surveyed parts of Manhattan.
Six methane (natural gas) leaks were tested by inserting a gas probe approximately 6 inches through a valve box cover, pre-existing drill holes, or accessible manhole opening. All of these were likely Grade 2 leaks (in need of repair but not posing immediate danger of explosion) with combustible gas concentrations at the tested locations as follows: 0.35%, 15%, 55%, 55%, 67%, and 70%. Determining the exact location of a leak requires excavation of the probable leaking gas line until the exact location of the leak or leaks is determined. Such efforts were beyond the scope of this methane survey.
Image 6 was prepared from the survey data to provide a visualization of the potential relative importance of the methane leakage from the gas system in Manhattan on a regional atmospheric scale. Further work is needed to determine whether an approximate estimate of the amount of methane being released to the atmosphere can be developed from the data generated by this preliminary methane survey. For this initial report the following table presents a brief comparison of two randomly selected one-hour data sets for Manhattan and an open country drive. The methane measurements in Manhattan indicated many leaks (8.44% of all measurements were >2.5 ppm), some intense (measured levels up to 47 ppm), and almost no measurements at normal background methane levels (only 0.05% of the measurements were ≤2.0 ppm). In contrast, in the open country data, 86.37% of the measured methane levels were ≤2.0 ppm and only 0.03% in a range indicating substantial methane leaks or sources in the vicinity of the measurements.
| Date-Time | 1129-1959Z | 1127-1514Z |
| Location | Manhattan | Open Country |
| Methane (ppm) | ||
| Max | 47.200 | 2.484 |
| Mean | 2.186 | 1.858 |
| Min | 1.897 | 1.787 |
| Distribution of measured methane levels | ||
| Total # measurements | 13215 | 13101 |
| % ≤ 2.0 ppm | 0.050 | 86.370 |
| % > 2.5 ppm | 8.44 | 0.03 |
Work is planned for further analysis and interpretation of the data produced during this preliminary investigation. This report reveals the need and provides a foundation for additional work to better evaluate the apparently substantial amounts of methane being released into the atmosphere from pipeline leaks in New York City.
